In the immediate aftermath of any disaster, there are always questions. The most urgent are: who needs help, where, what resources are available, and how will we get those resources to the people who need them. A great many decisions must be made in a short period of time. Any information that can support those decisions will be welcome. GIS has grown in the last decade into one of the most powerful decision-assistance tools.
The questions of who, where, what and how can all be stored, and when properly maintained and updated, can provide critical information to first-responders, volunteers, and those involved with long-term recovery. Relationships between locations and events can be analyzed and proper remediation can be planned. Areas that have been cleared will not be allocated precious manpower in pointless efforts.
At my workplace, South Florida Water Management District, the first week of June is 'Hurricane Freddy' (Freddy is our cartoon alligator mascot). This annual exercise is a dress rehearsal for the hurricane season, and includes testing the alert roster, assembling the EOC staff, and updating the GIS databases. All conceivable aspects of a potentially devastating storm are considered.
The Deepwater Horizon oil spill event is an excellent example of using GIS to assist the response to a catastrophe. It has the potential to affect millions of people and thousands of acres of sea and land, disrupting the economic and environmental balance of the whole Gulf of Mexico and beyond.
The most obvious use of GIS is to predict the movement of the oil with the known currents of the Gulf, and attempt to provide protection to the most sensitive areas of the coast. Records of what has been done and where will prevent duplication of effort and wasted money and resources. The hazard to health and safety can be tracked, and the specific members of the local population warned of impending danger.
Sunday, June 13, 2010
Module 5 - Urban Planning


This assignment went pretty smoothly. I didn't have any of the usual problems. The ESRI VC assignments are informative and well laid out. I think I even undestood the consepts, even though I've never done this type of work before.
Module 4 Deepwater Horizon Oil Spill


I didn't have too many problems with this assignment, but it seemed to take a long time to accomplish. I did't have any projection problems because I did a lot of prep work before I opened ArcMap. I collected all the data files, checked the projections, then chose UTM 16N for the working projection. I projected each file and saved them in a folder called "Projections", then made a sub folder called "clipped" and clipped all the files to the Quad I was working in. I finished at 5:05 PM EDT and then uploaded the wrong file format to the dropbox.
Saturday, June 12, 2010
Module 3 - Hurricanes

I'm really pretty embarrased by this product. I never did get past the elevation conversion. I fudged a flooding map by manually classifying the elevation in meters to display only the areas that would have been subject to the storm surge (2.4 meters). I could not do any of the analysis since that was all dependant on the conversion.
I was also dissatisfied with the resolution of the raster files when working at this large a scale. If I have any spare time (ha,ha) I' like to re-do the exercise with an elevation raster I stumbled on form work. It's a 10-foot DEM (as opposed to 30 meter) and it shows so much detail, looks almost like an aerial photo. I think I can get a High-resolution landcover file as well. I just need time to look.
Wednesday, April 28, 2010
Saturday, April 10, 2010
Module 11 : Labels and Spatial Analyst
Item 1: Cities and Roads from 'Mamage your Labels with Class'
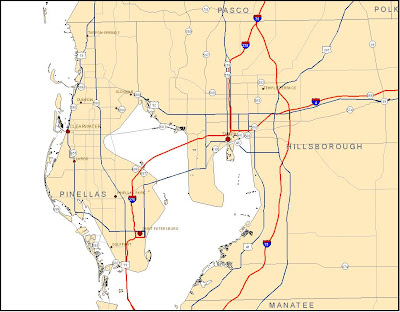 This exercise was a good supplement to the Cartography class's section on labels and annotation. I'm surprised that it did not cover the 'Change labels to annotation' function.
Item 2: Recreation from 'Add Custom Text to your Maps'
The model graphic seems to be a basic flow chart, providing a visual representation of the process.
Item 4: Reclassed vegetation map from 'Reclassify your Data to Common Scale'
 After I completed the reclassification, I changed the colors to accentuate the diffeent areas of tolerance and changed the legend labels to meaningful words as opposed to numbers.
 This exercise was a good supplement to the Cartography class's section on labels and annotation. I'm surprised that it did not cover the 'Change labels to annotation' function.
Item 2: Recreation from 'Add Custom Text to your Maps'
 The ability to use the spline labels and call-outs will be very handy in future assignments.
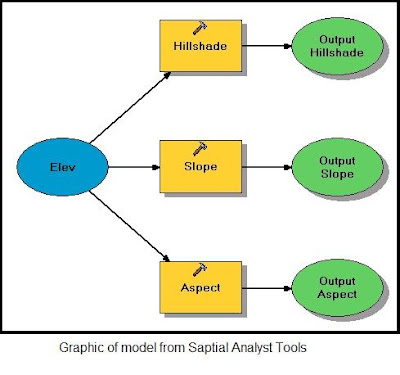
Item 3: Screen snapshot of model graphic from 'Working with Spatial analyst Tools'

The model graphic seems to be a basic flow chart, providing a visual representation of the process.
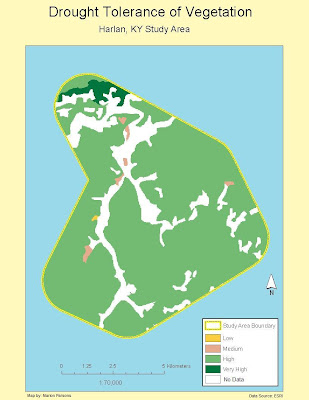
Item 4: Reclassed vegetation map from 'Reclassify your Data to Common Scale'
 After I completed the reclassification, I changed the colors to accentuate the diffeent areas of tolerance and changed the legend labels to meaningful words as opposed to numbers.
Friday, April 9, 2010
Module 9: Raw Data and Tables

I accidently deleted this post while reviewing the blog in preparation for the week 11 work. Fortunately I had an extra saved copy of the map.
I had a difficult time finding the right file to download on the DOR website. There were several tables and only one included the combination of Parcel ID and Owner's name. From there, doing the Smmary and selecting the four largest landowners was fairly easy. I created a new layer and defined the four different colors to the property owners.
Subscribe to:
Comments (Atom)